When Los Angeles air quality spikes, your HVAC system is already filtering your indoor air — the real question is whether it's equipped to handle the surge. On Code Red and Code Purple days, PM2.5 from wildfire smoke and smog doesn't wait for an open window. It infiltrates through gaps and an underprepared system running the wrong filter.
After manufacturing air filters for over a decade and serving more than two million households, we know what separates a home that's genuinely protected from one that just feels that way. The difference almost always comes down to filter rating, fit, and timing — three variables that matter far more when LA's AQI climbs.
Here, we break down how HVAC filtration intercepts the pollutants driving LA's worst air days, how the air quality index map los angeles helps you understand those risks in real time, which MERV ratings give your system a real protective edge, and what you can do right now to make your home an actual refuge from outdoor air — not just a sealed version of it.
TL;DR Quick Answers
air quality index map los angeles
Los Angeles air quality is monitored across more than 1,000 neighborhood-level locations throughout the LA Basin. The two most authoritative real-time AQI maps for Los Angeles are:
South Coast AQMD Interactive Map: Neighborhood-level AQI readings for Los Angeles, Orange, San Bernardino, and Riverside counties — updated continuously using regulatory monitors and hundreds of PM2.5 sensors: https://www.aqmd.gov/home/air-quality/current-air-quality-data
EPA AirNow Interactive Map: Federal-standard AQI readings for ozone, PM2.5, and PM10 across all LA Basin monitoring stations: https://www.airnow.gov/maps-and-data/
During wildfire smoke events, also bookmark the EPA/USFS Fire and Smoke Map at https://fire.airnow.gov/ — it tracks active fire locations, smoke plumes, and real-time PM2.5 concentrations across the region.
Los Angeles AQI is driven by three primary factors:
Vehicle emissions and industrial pollution — persistent year-round stressors
Seasonal ozone events — concentrated June through September
Wildfire smoke and Santa Ana wind events — capable of pushing AQI from Moderate to Hazardous within hours
After manufacturing air filters for over a decade and serving more than two million households, the pattern we see consistently in LA is this: the homes best protected on high AQI days are the ones that use the map proactively — checking the South Coast AQMD's next-day forecast before conditions arrive, not after.
Top Takeaways
MERV rating determines real protection on high AQI days. MERV 13 running continuously cuts indoor PM2.5 by ~50%. A low-efficiency filter cuts it by ~24%. In Los Angeles, that gap matters.
Sealed homes still let smoke in. Indoor PM2.5 reaches 55 to 60 percent of outdoor levels even with doors and windows closed. In some homes, it reaches 100 percent. Your filter is what stands between infiltrating particulate and your family's air.
A filter that doesn't seal completely doesn't protect completely. Bypass gaps of 10 to 15 percent around a poorly fitted filter significantly undermine even a high-rated filter. Fit and seal matter as much as MERV rating — especially on Code Purple days.
LA's air quality calendar demands its own filter change schedule. Smoke events load filters in weeks, not months. LA County's baseline PM2.5 already exceeds the revised federal standard before fire season begins. A generic 90-day reminder is not built for this city.
Bookmark these three resources — and check them before conditions deteriorate:
South Coast AQMD Current Air Quality Map — neighborhood-level, real-time AQI readings
EPA AirNow Fire and Smoke Map — wildfire locations, smoke plumes, and PM2.5 concentrations
South Coast AQMD Next-Day Forecasts — know what's coming before it arrives
What Happens to Your Indoor Air When LA's AQI Spikes
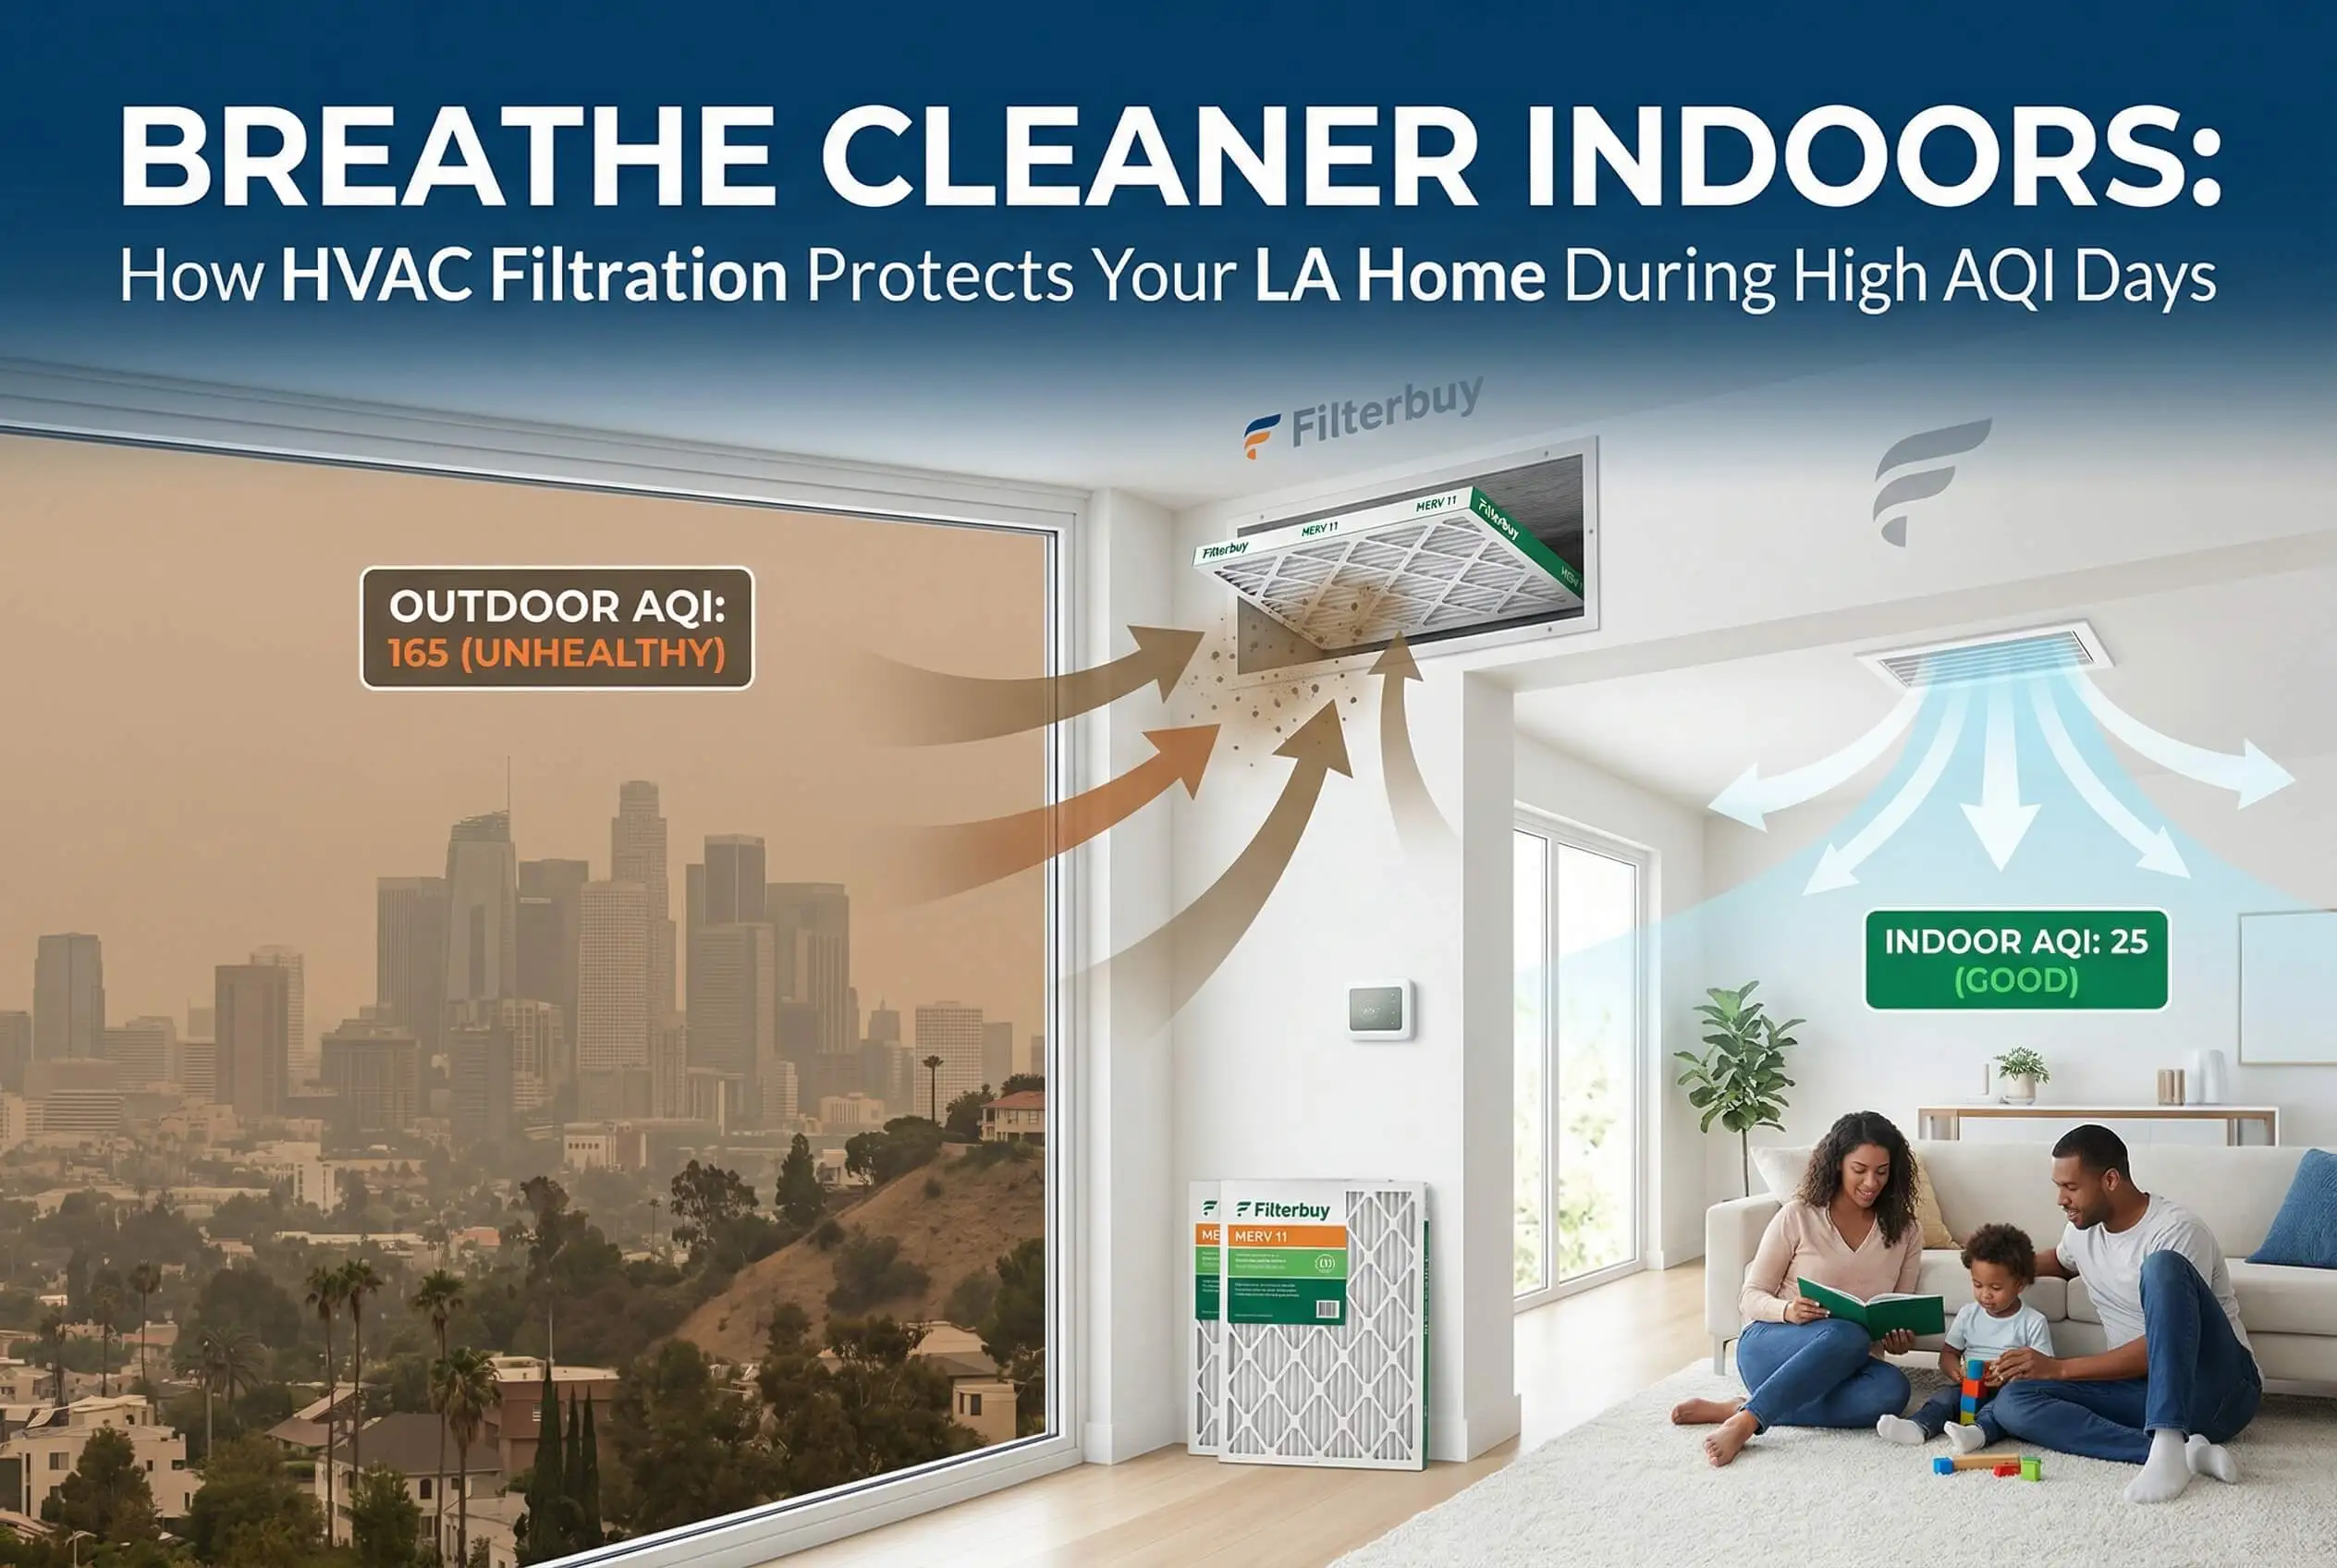
High AQI days in Los Angeles don't just affect the air outside — they pressure-test everything standing between your family and that air. When the AQI crosses into the Unhealthy range, outdoor PM2.5 concentrations rise sharply. Your HVAC system cycles on, draws air through the return ducts, and passes it across your filter. What that filter captures — and what it lets through — determines the air quality inside your home.
In our experience working with homeowners across high-pollution regions, the most common mistake is assuming a sealed home is a protected home. It isn't. Fine particulate matter at 2.5 microns or smaller moves through building envelope gaps continuously. Without the right filter in place, your HVAC system can actually distribute that particulate throughout every room it serves.
Why MERV Rating Is the Most Important Variable on Bad Air Days
Not all filters respond the same way when outdoor air quality deteriorates. MERV — Minimum Efficiency Reporting Value — is the standard measurement of how effectively a filter captures particles across a range of sizes. Here's what that means in practical terms on a high AQI day in LA:
MERV 1–7: Captures large particles like dust and lint. Offers minimal protection against the fine PM2.5 driving air quality alerts.
MERV 8–10: A meaningful step up. Captures mold spores and some smoke particles, but still allows finer pollutants to pass through.
MERV 11–13: The range we most commonly recommend for households in pollution-prone areas like Los Angeles. Captures a significant portion of PM2.5, fine smoke particles, and combustion byproducts.
MERV 14+: High-efficiency filtration typically found in commercial or medical settings. Can restrict airflow in residential systems not designed to handle the added resistance.
After manufacturing filters across this entire MERV spectrum, we've seen that MERV 11 to 13 consistently delivers the best balance of particle capture and airflow for most LA homes — without putting unnecessary strain on the blower motor.
How Wildfire Smoke Specifically Challenges Residential Filtration
Wildfire smoke is not the same as everyday urban smog. It carries an unusually dense concentration of ultrafine particles, volatile organic compounds, and combustion gases — a combination that exposes the limits of lower-rated filters quickly. During active fire events affecting the Greater Los Angeles area, AQI readings regularly reach the Very Unhealthy and Hazardous categories, levels at which even short indoor exposure to unfiltered air carries measurable health risk according to the EPA.
From our manufacturing experience, smoke events also tend to accelerate filter loading — meaning a filter that might last 90 days under normal conditions can become saturated significantly faster when outdoor smoke concentrations are elevated. A clogged filter doesn't just perform poorly; it restricts airflow and forces your system to work harder, compounding the problem.
The Role of Filter Fit in Protecting Your Home
A high-rated filter only works if it's properly seated in the housing. Filter bypass — air flowing around the filter rather than through it — is one of the most underestimated sources of indoor air quality failure during high AQI events. It happens when:
The filter is the wrong size for the housing
The frame is warped or damaged
The filter is installed in the wrong orientation
Gaps exist around the filter due to a poorly fitting return air grille
In our experience, even a MERV 13 filter loses much of its protective value if 10 to 15 percent of airflow is bypassing it entirely. Fit and seal matter as much as rating — especially when outdoor conditions are at their worst.
When to Change Your Filter Around High AQI Events
Timing your filter changes around LA's air quality calendar is a practical strategy that most homeowners overlook. The South Coast Air Quality Management District tracks and forecasts AQI conditions across the Los Angeles Basin. Using that information to anticipate elevated pollution periods — wildfire season, late summer ozone events, Santa Ana wind episodes — gives you the opportunity to start those periods with a fresh filter rather than one that's already partially loaded.
Our general guidance for Los Angeles households during elevated AQI periods:
Before a forecasted smoke or high-pollution event: Install a fresh MERV 11 to 13 filter to begin the event at peak filtration efficiency.
During a sustained high AQI period: Check the filter every two to three weeks rather than relying on a standard 90-day schedule.
After the event clears: Replace the filter again, as smoke and fine particulate events leave filters heavily loaded even after outdoor air improves.
What Your HVAC System Can and Cannot Do
HVAC filtration is a powerful tool for protecting indoor air quality during high AQI days — but it works within limits. Your system filters the air it circulates. It does not ventilate, and it does not address pollutants that enter through sources outside the duct system. Supplementing HVAC filtration with portable air purifiers in frequently occupied rooms adds a meaningful second layer of protection during severe air quality events.
The foundation, however, remains the same: the right filter, properly fitted, changed at the right time. For Los Angeles households navigating some of the most variable and severe air quality conditions in the country, that foundation is what separates genuinely cleaner indoor air from air that only appears protected.
"Los Angeles tests residential filtration in ways most cities simply don't. Between wildfire smoke seasons, late-summer ozone events, and Santa Ana wind episodes, we see the full range of what elevated outdoor air quality does to indoor environments — and to filters. What stands out after manufacturing filters for over a decade and working with households across high-pollution regions is how consistently the same three factors determine whether a home is genuinely protected or just nominally so: the right MERV rating for the conditions, a filter that seals completely in the housing, and a change schedule built around LA's air quality calendar rather than a generic 90-day reminder. When all three are in place, your HVAC system stops being a passive component and becomes an active defense. When even one is off, that defense has a gap — and on a Code Purple day in Los Angeles, that gap matters."
Essential Resources
After manufacturing air filters for over a decade and serving more than two million households, we know that acting on bad air days in Los Angeles starts with knowing where to look. The resources below are the ones we point LA homeowners to first — authoritative, government-sourced, and built for exactly the conditions that test your home's air quality most.
1. South Coast AQMD — See What the Air in Your LA Neighborhood Is Actually Doing Right Now
Most LA homeowners assume outdoor air quality is the same across the basin. It isn't — and the South Coast AQMD's interactive map proves it, delivering neighborhood-level AQI readings across more than 1,000 locations by blending regulatory monitor data with hundreds of low-cost PM2.5 sensors. This is the most granular real-time picture of LA air quality available to the public, and the first resource we recommend when conditions start to shift. https://www.aqmd.gov/home/air-quality/current-air-quality-data
2. EPA AirNow — The Federal Standard for Real-Time AQI Data Across the LA Basin
The EPA's AirNow interactive map tracks real-time ozone, PM2.5, and PM10 readings across every Los Angeles Basin monitoring station, with contour mapping and a 24-hour time slider that shows how air quality has moved throughout the day. When we cross-reference local conditions against a national standard, this is the tool we rely on. https://www.airnow.gov/maps-and-data/
3. EPA / USFS AirNow — The Fire and Smoke Map Every LA Homeowner Needs Bookmarked
Wildfire smoke is not ordinary air pollution, and it requires a dedicated resource. Jointly developed by the EPA and U.S. Forest Service, this map tracks active fire locations, smoke plumes, and real-time PM2.5 concentrations using both regulatory monitors and crowdsourced sensor data. In our experience, this is the map that matters most during the events that push LA's AQI into Hazardous territory. https://fire.airnow.gov/
4. South Coast AQMD — Know Tomorrow's Air Quality Before It Arrives
One of the most effective things an LA homeowner can do on high-pollution days is prepare before they happen. The South Coast AQMD publishes next-day AQI forecasts for all Los Angeles County forecast areas by noon each day, searchable by ZIP code. Starting a smoke or ozone event with a fresh filter already in place is the kind of proactive protection that makes a measurable difference indoors. https://www.aqmd.gov/home/air-quality/air-quality-forecasts
5. EPA AirNow — Track What's Coming Into the LA Basin Before It Gets There
Pollution doesn't originate at the LA city limits — wildfire smoke and regional ozone events move into the basin from surrounding areas before local monitors catch up. The EPA's California statewide AQI view gives LA households an upstream look at what's approaching, turning air quality awareness from reactive to genuinely protective. https://www.airnow.gov/state/?name=california
6. California Air Resources Board (CARB) — California's Authoritative Source for Air Quality Monitoring Data
CARB has maintained one of the most extensive air monitoring networks in the world for more than 50 years, collecting data across all 35 California air districts including the South Coast. For homeowners who want to understand long-term air quality trends in Los Angeles County — not just today's reading — this is the historical and real-time data source we trust. https://ww2.arb.ca.gov/our-work/topics/air-quality-monitoring
7. EPA AirNow — What the AQI Numbers on Every LA Air Quality Map Actually Mean
A map is only as useful as your understanding of what it's telling you. The EPA's AQI Basics resource explains how the index is calculated, what each of the six categories — from Good to Hazardous — means for your family's health, and which pollutants are being measured. Before acting on any LA air quality map, this is the foundation every homeowner should have. https://www.airnow.gov/aqi/aqi-basics/
Supporting Statistics
The numbers behind Los Angeles air quality don't just describe outdoor pollution. They describe what's happening inside homes running the wrong filter — or the right filter changed too late. After manufacturing air filters for over a decade and serving more than two million households, we've learned these statistics aren't abstract. They're conditions we see reflected in the filters LA homeowners replace during and after smoke events: heavily loaded, discolored, and overdue.
Closing Doors and Windows Reduces Smoke Infiltration. It Does Not Stop It.
During wildfire smoke events, indoor PM2.5 levels typically reach 55 to 60 percent of outdoor concentrations even with doors and windows closed and no air cleaner operating. In the most vulnerable homes, that ratio reaches 100 percent.
What this means in practice:
Sealing your home slows infiltration — it does not eliminate it
Fine particulate matter small enough to trigger AQI alerts is small enough to find its way through
The HVAC system running in the background determines how much of that PM2.5 your family actually breathes indoors
Source: U.S. Environmental Protection Agency — Strategies to Reduce Exposure Indoors (Wildfire Smoke Course) https://www.epa.gov/wildfire-smoke-course/strategies-reduce-exposure-indoors
The Gap Between a MERV 13 and a Low-Efficiency Filter Is the Difference Between Half the PM2.5 and a Quarter of It.
The EPA documents this directly. During smoky periods with the HVAC fan running continuously:
MERV 13 filter: approximately 50 percent reduction in indoor PM2.5
Typical low-efficiency filter: approximately 24 percent reduction
That spread is the measurable cost of the wrong filter on a Code Purple day in Los Angeles. PM2.5 is invisible — but the difference between 50 percent and 24 percent removal determines whether the air inside your home is genuinely safer, or merely indoors.
Source: U.S. Environmental Protection Agency — Strategies to Reduce Exposure Indoors (Wildfire Smoke Course) https://www.epa.gov/wildfire-smoke-course/strategies-reduce-exposure-indoors
Wildfire Smoke Now Accounts for an Estimated 52 Percent of All PM2.5 Emitted Across the United States.
The EPA's 2020 National Emissions Inventory confirmed what we've watched reshape the residential filtration conversation over the past decade: wildland fires are now the single largest source of PM2.5 in the country — surpassing traffic, industrial emissions, and agriculture combined.
For LA households, this matters because:
Smog and vehicle emissions are persistent stressors on your filter
Wildfire smoke events are what push AQI into Hazardous territory and load a filter in weeks instead of months
A filter adequate for everyday urban pollution is often insufficient for the conditions Los Angeles now routinely faces
Serving households across wildfire-affected regions has shown us this firsthand. The data confirms it.
Source: U.S. Environmental Protection Agency — Wildland Fire Research: Reducing Exposures https://www.epa.gov/air-research/wildland-fire-research-reducing-exposures
Los Angeles County's Baseline PM2.5 Exceeds the Federal Health Standard — Before Wildfire Season Adds to It.
In February 2024, the EPA tightened the federal primary annual PM2.5 standard from 12.0 to 9.0 micrograms per cubic meter. EPA monitoring data recorded Los Angeles County's annual PM2.5 design value at 13.4 micrograms per cubic meter — nearly 50 percent above that revised threshold at baseline.
What this means for filter maintenance in LA:
A 90-day replacement schedule designed for cities with clean ambient air does not apply here
LA County hasn't met federal PM2.5 standards in decades and ranks among the most polluted counties in the nation
The filter question in Los Angeles isn't only about what's in the air today — it's about what has been accumulating since the last change
In our experience working with homeowners in persistently high-pollution markets, baseline conditions change what responsible filter maintenance looks like, especially when indoor air quality affects sleep. Los Angeles is not an average market. It shouldn't be treated like one.
Sources: California Air Resources Board — PM2.5 Federal Area Designations https://ww2.arb.ca.gov/our-work/programs/state-and-federal-area-designations/federal-area-designations/pm2-5
U.S. Environmental Protection Agency — Fine Particle Concentrations for Counties with Monitors (2020–2022) https://www.epa.gov/system/files/documents/2024-02/table_annual-pm25-county-design-values-2020-2022-for-web.pdf
Final Thoughts
On high AQI days in Los Angeles, your HVAC system is either working for your family or falling short of what the conditions demand. After manufacturing air filters for over a decade and serving more than two million households, the conclusion we keep reaching is the same: the gap between genuinely protected indoor air and air that only feels safe almost always comes down to three things.
The right MERV rating for LA's specific pollution conditions
A filter properly seated with no bypass gaps
A change schedule built around LA's air quality calendar — not a generic reminder
Wildfire smoke, seasonal smog, and Santa Ana wind events don't follow a predictable schedule. What they do follow is a pattern — and that pattern is well-documented by the South Coast AQMD, the EPA, and CARB. Using those resources to anticipate elevated AQI periods and time your air ionizer installation before conditions worsen, rather than react to them, is what separates proactive indoor air protection from an afterthought.
A few things worth keeping in mind:
HVAC filtration filters the air your system circulates — it does not address pollutants entering through sources outside the duct system
Supplementing with a portable air purifier in high-use rooms adds a meaningful second layer during severe events
No filter performs at its rated efficiency when it's overloaded, improperly fitted, or overdue for replacement
The foundation stays the same regardless of the event: the right filter, properly installed, changed at the right time, and supported by the right air purifier. In a city that routinely ranks among the most air-polluted in the country — and that hasn't met federal PM2.5 standards in decades — that foundation isn't routine maintenance. It's how your home earns the right to be called a refuge.
FAQ on Air Quality Index Map Los Angeles
Q: What is the most accurate real-time air quality index map for Los Angeles?
A: For neighborhood-level accuracy, two resources stand above the rest:
South Coast AQMD Interactive Map: The resource we point LA homeowners to first. Pulls from regulatory monitors, hundreds of PM2.5 sensors, and forecast modeling across more than 1,000 locations. AQI conditions can vary significantly from neighborhood to neighborhood during a smoke event — this map captures that granularity.
EPA AirNow Interactive Map: The federal-standard complement. Tracks ozone, PM2.5, and PM10 across all LA Basin monitoring stations.
In our experience, using both together gives homeowners the most complete picture of what's actually in the air around their home.
Q: What do the color-coded AQI categories on Los Angeles air quality maps mean?
A: Each color represents a defined health threshold. For LA households, knowing where the actionable ones begin is what matters most:
Green (0–50): Good. No health concern for the general public.
Yellow (51–100): Moderate. Acceptable for most. Unusually sensitive individuals may experience minor effects.
Orange (101–150): Unhealthy for Sensitive Groups. Children, older adults, and those with respiratory conditions should limit outdoor activity. This is the threshold where indoor filtration strategy starts to matter.
Red (151–200): Unhealthy. Everyone may begin to experience health effects. Run the HVAC fan continuously with a high-rated filter installed.
Purple (201–300): Very Unhealthy. Stay indoors and maximize filtration. Filters in LA homes load in days — not weeks — at this level.
Maroon (301–500): Hazardous. Remain indoors. Every layer of filtration protection counts.
After manufacturing filters across the full range of AQI events LA produces, Code Orange is where the filter conversation becomes a health conversation.
Q: How often does Los Angeles reach unhealthy air quality levels?
A: Far more often than the city's reputation for sunshine suggests. Key facts:
LA County consistently ranks among the highest in the nation for annual unhealthy air quality days
Unhealthy events span multiple seasons — summer ozone events run June through September; wildfire smoke and Santa Ana wind events extend elevated AQI well into fall and winter
In February 2024, the EPA tightened the federal annual PM2.5 standard to 9.0 micrograms per cubic meter
LA County's recorded design value of 13.4 micrograms per cubic meter leaves it nearly 50 percent above that revised threshold — at baseline, before a single wildfire ignites
In our experience working with households in persistently high-pollution markets, that baseline is what makes LA's filter maintenance demands different from almost anywhere else in the country.
Q: How does wildfire smoke affect the Los Angeles AQI map differently than everyday smog?
A: Smog and wildfire smoke both elevate the AQI — but they behave very differently on the map and on your filter:
Smog builds gradually. It concentrates in predictable inland areas during summer months, driven by ozone formation from vehicle exhaust and sunlight.
Wildfire smoke moves faster and hits harder. It affects the entire basin simultaneously. A map showing Moderate conditions at noon can show Very Unhealthy conditions by evening when smoke arrives.
The scale difference matters too. The EPA's 2020 National Emissions Inventory found wildland fires account for an estimated 52 percent of total U.S. PM2.5 emissions. After serving households across wildfire-affected regions, we've seen how quickly smoke loads a filter — and how unprepared most homes are when it arrives.
On the AQI map, the signal to watch for: rapid, widespread color escalation across multiple monitoring zones simultaneously. That pattern means smoke — not smog — is driving conditions.
Q: How should Los Angeles homeowners use the AQI map to make better decisions about their HVAC filtration?
A: The AQI map is most valuable when it drives action before conditions deteriorate — not after. The South Coast AQMD publishes next-day forecasts by noon each day. That window is the opportunity most LA homeowners miss.
Based on manufacturing filters for households across high-pollution regions, here is how to translate AQI readings into filtration decisions:
Before a forecasted Code Orange or higher: Install a fresh MERV 11 to 13 filter to start the event at peak efficiency
During Code Red or Purple conditions: Switch the HVAC thermostat from Auto to On — continuous fan operation maximizes particulate capture
Every two to three weeks during active smoke events: Check the filter for loading rather than following a standard schedule
After the event clears: Replace the filter — smoke leaves filters heavily loaded even after the AQI map returns to green
The map tells you what the air is doing outside. Your filter determines what your family breathes inside.
Protect Your Home's Indoor Air on Los Angeles's Worst AQI Days
The right filter makes the difference between a home that's genuinely protected and one that only feels that way — and on a Code Red or Code Purple day in Los Angeles, that difference is your family's health. Find the right MERV-rated filter for your home at Filterbuy.com and start your highest-AQI days with the protection your household deserves.


